
Demographics are the criteria about a society that can be broken down into many different fields of information. We will provide just some demographic information that may be useful to the traveler in Europe.
Statistics can vary depending on how one currently defines boarders. In recent years independence, disputed and occupied areas of some countries have added to this confusion. Russians do make up the largest portion of the population with Germans second. The following are totals for European ethno-linguistic groups that reside not within just within their countries but, also in other European countries as a whole.
- Russians – 100 m
- Germans – 93 m
- French – 72 m
- British – 66 m
- Italians – 60 m
- Ukrainians – 38-55 m
- Spaniards – 41-50 m
- Poles – 38-45 m
- Romanians – 20-25 m
- Dutch – 15-25 m
- Turks – 10-20 m
- Portuguese – 15 m
- Greeks – 15 m
- Czechs – 10 m
- Hungarians – 10 m
- Serbs – 10 m
While most of Europe is of caucasian European ancestry, Europe is seeing and ever growing minority population similar to the US. Since World War II Europe’s population has had an overall negative growth rate. Immigration can always change the face of a culture and just like in the US., the need for laborers and workers, has been filled primarily by immigrants from other countries. France has had growth with north African immigrants and Germany with Turkish. Recently a wave of refugees seeking asylum from conflicts in the Middle East. There is some opposition to this immigration also a, as people are afraid it will change the country they live and not for the better. For more detailed information on ethno-linguistics groups by country, go to our ➾ People section below.
Religion has also changed in most of Europe. While dominated by christianity for centuries, some countries have growing numbers of non-believers. As well, the influx of immigrants have brought a rise of other faiths, mainly Islam. Listed below on this page are some statistics on population and languages.
Population…
Europe is the 3rd most populous continent behind Asia and Africa with a population of 739 million. Today is about 12% of the worlds total population with its height at 28% in 1913.
Being the second smallest continent makes it rather densely populated at 72.9 inhabitants per km, second behind Asia. However, Europe’s population growth rate is one of the smallest at 0.212% with the world rate at 1.89%.
The Europe Union has an estimated 2016 population of 513,949,445 making it the third most populated country behind China and India.
| Country | 2020 est. | world share | world rank | urban pop.% |
|---|---|---|---|---|
| 141,722,205 | 1.87% | 9 | 73.0% | |
| Europe Russia | 113,112,406 | 14.26 % | ||
| 82,017,514 | 1.06 % | 18 | 73.4% | |
| 80,159,662 | 1.07 % | 19 | 76% | |
| 67,848,156 | 0.85% | 21 | 81% | |
| 65,761,117 | 0.87% | 22 | 81% | |
| 53,012,456 | ||||
| 5,404,700 | ||||
| 3,113,200 | ||||
| N. Ireland | 3,113,200 | |||
| 62,402,659 | 0.77% | 23 | 71% | |
| 50,015,792 | 0.60% | 29 | 83% | |
| 43,922,939 | 0.57% | 33 | 70% | |
| 38,282,325 | 0.49% | 37 | 61% | |
| 21,302,893 | 0.25% | 59 | 61% | |
| 17,280,397 | 0.22% | 67 | 92% | |
| 11,720,716 | 0.15% | 80 | 96% | |
| 10,702,498 | 0.14% | 85 | 75% | |
| 10,607,051 | 0.14% | 86 | 79% | |
| 10,302,674 | 0.13% | 89 | 68% | |
| 10,202,491 | 0.13% | 91 | 86% | |
| 9,771,827 | 0.13% | 93 | 74% | |
| 9,477,918 | 0.12% | 94 | 75% | |
| 8,859,449 | 0.114% | 97 | 58.3% | |
| 8,403,994 | 0.11% | 100 | 74% | |
| 7,012,165 | 0.092% | 105 | 55.6% | |
| 6,966,899 | 0.092% | 106 | 73.9% | |
| 5,869,410 | 0.076% | 115 | 87.7% | |
| 5,571,665 | 0.072% | 116 | 84.2% | |
| 5,467,439 | 0.069% | 119 | 80.5% | |
| 5,440,602 | 0.071% | 120 | 53.6% | |
| 5,176,569 | 0.063% | 122 | 63.2% | |
| 4,227,746 | 0.054% | 127 | 59.0% | |
| 3,835,586 | 0.047% | 131 | 39.8% | |
| 3,364,496 | 0.047% | 133 | 45.0% | |
| 3,074,579 | 0.038% | 136 | 57.4% | |
| 2,731,464 | 0.037% | 141 | 66.5% | |
| 2,125,971 | 0.027% | 147 | 57.1% | |
| 2,102,678 | 0.027% | 148 | 49.6% | |
| 1,932,774 | 0.023% | 150 | N/A | |
| 1,881,232 | 0.025% | 153 | 67.4% | |
| 1,266,676 | 0.011% | 157 | 66.9% | |
| 1,228,624 | 0.017% | 158 | 67.5% | |
| 628,381 | 0.0079% | 169 | 90.2% | |
| 609,859 | 0.0082% | 171 | 64.0% | |
| 457,267 | 0.0057% | 175 | 95.4% | |
| 350,734 | 0.0046% | 178 | 94.1 | |
| 101,073 | 0.0041% | 196 | N/A | |
| 90,499 | 0.0011% | 199 | N/A | |
| 77,000 | 0.001% | 201 | N/A | |
| 67,052 | 0.0082% | 204 | N/A | |
| 51,628 | 0.00067% | 209 | 43% | |
| 39,137 | 0.0005% | 213 | 14.3% | |
| 39,000 | 0.0005% | 214 | 100% | |
| 34,232 | 0.00044% | 216 | 92.4% | |
| 29,581 | 0.00044% | 218 | 100% | |
| 2,926 | N/A | 230 | N/A | |
| 1,000 | 0.00001% | 236 | 100% |
Being the second smallest continent makes it rather densely populated at 72.9 inhabitants per km, second behind Asia. Most European countries are more densely populated that the Untied States rate of 86 people per square mile.
However, Europe’s population growth rate is one of the smallest at 0.212% with the world rate at 1.89%. Table below is ranked by population destiny. Monaco having the highest destiny of people per square mile and Iceland with the lowest.
Population Destiny by Country
| Country | Area (sq.mi) | Density (sq.mi) | Annual Growth Rate | Growth Rank |
|---|---|---|---|---|
| Monaco | .78 | 48,1450 | 0.65 | 162 |
| Holy See – Vatican | .17 | 4,709 | 0.03 | 236 |
| Malta | 122 | 3,784 | 0.55 | 168 |
| San Marino | 24 | 1,414 | 0.78 | 142 |
| Netherlands | 16,033 | 1,075 | 0.30 | 202 |
| Belgium | 11,787 | 969 | 0.63 | 165 |
| United Kingdom | 93,788 | 702 | 0.65 | 163 |
| England | 50,301 | 1,098 | ||
| N. Ireland | 5,456 | 344 | ||
| Scotland | 30,981 | 174 | ||
| Wales | 8,023 | 388 | ||
| Liechtenstein | 62 | 614 | 0.76 | 65 |
| Luxembourg | 998 | 603 | 1.80 | 57 |
| Germany | 137,903 | 601 | 0.20 | 207 |
| Switzerland | 15,940 | 531 | 1.21 | 127 |
| Italy | 116,336 | 521 | -0.08 | 183 |
| Andorra | 179 | 448 | -1.59 | 193 |
| Kosovo | 4,212 | 422 | 1.08 | 151 |
| Cyprus | 2,276 | 376 | 1.15 | 94 |
| Czechia | 30,451 | 350 | 0.13 | 213 |
| Denmark | 16,640 | 347 | 0.48 | 179 |
| France | 210,026 | 321 | 0.45 | 184 |
| Poland | 120,728 | 319 | -0.03 | 209 |
| Portugal | 35,556 | 290 | -0.44 | 192 |
| Slovakia | 18,933 | 287 | 0.13 | 214 |
| Austria | 32,386 | 272 | 0.63 | 164 |
| Hungary | 35,919 | 272 | -0.29 | 216 |
| Moldova | 13,067 | 272 | -0.09 | 231 |
| Turkey | 302,535 | 267 | 1.58 | 98 |
| Slovenia | 7,827 | 264 | 0.29 | 202 |
| Albania | 11,082 | 259 | 0.31 | 175 |
| Spain | 195,364 | 238 | -0.17 | 130 |
| Serbia | 29,913 | 231 | -0.40 | 224 |
| Romania | 92,043 | 212 | -0.56 | 221 |
| Greece | 50,949 | 212 | -0.40 | 204 |
| North Macedonia | 9,928 | 210 | 0.08 | 217 |
| Croatia | 21,831 | 189 | -0.43 | 226 |
| Ukraine | 232,820 | 181 | -0.50 | 223 |
| Bosnia Herzegovina | 19,772 | 179 | -0.03 | 210 |
| Ireland | 27,133 | 176 | 0.31 | 201 |
| Bulgaria | 42,858 | 166 | -0.26 | 229 |
| Belarus | 80,155 | 119 | 0.03 | 215 |
| Montenegro | 5,333 | 117 | 0.12 | 215 |
| Lithuania | 25,212 | 111 | -1.27 | 232 |
| Latvia | 24,928 | 78 | -1.30 | 233 |
| Estonia | 17,505 | 75 | -0.25 | 228 |
| Sweden | 173,860 | 58 | 0.78 | 156 |
| Norway | 125,013 | 41 | 1.25 | 123 |
| Finland | 130,666 | 41 | 0.43 | 190 |
| Russia | 6,612,093 | 23 | 0.04 | 219 |
| Europe Russia | 3,992,500 | 27.22 | ||
| Iceland | 39,682 | 9 | 0.61 | 166 |
EUROPEAN CITY POPULATIONS…
| City, Country | Urban Area Population | Metro Area Population | Within City Population |
|---|---|---|---|
| Istanbul, Turkey | 15,569,856 | 16,100,000 | 15,907,951 |
| Moscow, Russia | 12,641,000 | 18,800,000 | 13,010,112 |
| London, United Kingdom | 9,426,000 | 14,800,000 | 8,799,800 |
| Paris, France | 11,142,000 | 11,400,000 | 2,102,650 |
| Madrid, Spain | 6,714,000 | 6,850,000 | 3,280,782 |
| St. Petersburg, Russia | 6,400,000 | 5,600,044 | |
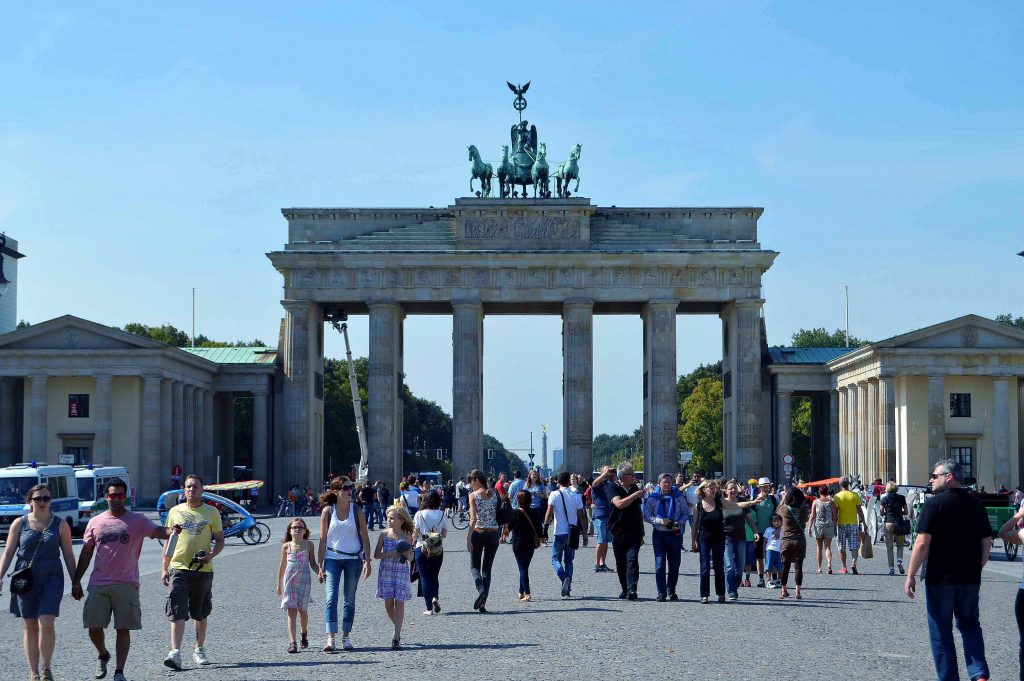
| Berlin, Germany | 6,144,600 | 5,303,846 | 3,850,809 |
| Munich, Germany | 2,606,021 | 5,991,144 | 1,512,491 |
| Frankfurt am Rhine, Germany | 2,319,029 | 5,604,523 | 773,068 |
| Barcelona, Spain | 5,658,000 | 5,575,204 | 1,636,193 |
| Stuttgart, Germany | 2,787,724 | 5,465,093 | 626,275 |
| Hamburg, Germany | 2,484,800 | 5,425,628 | 1,945,532 |
| Rome, Italy | 4,298,000 | 4,342,212 | 2,748,109 |
| Milan, Italy | 6,100,000 | 1,354,196 | |
| Birmingham, England, UK | 2,919,600 | 4,300,000 | 1,144,900 |
| Manchester, United Kingdom | 2,705,000 | 3,712,997 | 551,938 |
| Athens, Greece | 3,154,000 | 3,638,281 | 643,452 |
| Nuremberg, Germany | 1,374,524 | 3,610,543 | 523,026 |
| Kyiv, Ukraine | 3,475,000 | 2,952,301 | |
| Amsterdam, Netherlands | 1,970,000 | 3,269,905 | 921,402 |
| Warsaw, Poland | 3,100,844 | 1,863,056 | |
| Marseille, France | 1,618,479 | 3,100,329 | 870,321 |
| Naples, Italy | 3,084,890 | 909,048 | |
| Budapest, Hungary | 2,997,958 | 3,011,598 | 1,706,851 |
| Düsseldorf, Germany | 1,527,176 | 2,944,700 | 619,477 |
| Cologne, Germany | 3,500,000 | 2,919,070 | 1,073,096 |
| Lisbon, Portugal | 2,846,332 | 548,703 | |
| Vienna, Austria | 1,951,354 | 2,890,577 | 1,982,442 |
| Katowice, Poland | 2,710,397 | 2,773,751 | 286,960 |
| Prague, Czechia | 2,677,964 | 1,357,326 | |
| Lille, France | 1,053,636 | 2,594,456 | 236,234 |
| Valencia, Spain | 1,595,000 | 2,540,588 | 792,492 |
| Brussels, Belgium | 2,500,000 | 1,235,192 | |
| Stockholm, Sweden | 2,121,000 | 2,415,139 | 1,000,000 |
| Bremen, Germany | 1,244,363 | 2,400,000 | 563,290 |
| The Hague, Netherlands | 883,720 | 2,390,101 | 549,163 |
| Mannheim, Germany | 1,172,821 | 2,362,046 | 311,831 |
| Bucharest, Romania | 2,304,408 | 1,739,297 | |
| Lyon, France | 2,188,759 | 2,293,180 | 522,228 |
| Rotterdam, Netherlands | 1,818,563 | 2,390,101 | 664,311 |
| Turin, Italy | 2,259,523 | 847,287 | |
| Liverpool, England, UK | 864,122 | 2,241,000 | 500,500 |
| Dublin, Ireland | 1,263,219 | 2,107,749 | 592,713 |
| Copenhagen, Denmark | 1,366,301 | 2,135,634 | 656,787 |
| Glasgow, Scotland, UK | 1,028,220 | 1,861,315 | 626,410 |
| Porto, Portugal | 1,278,210 | 1,736,228 | 231,800 |
| Kharkiv, Ukraine | 1,729,049 | 1,421,225 | |
| Portsmouth/Southampton, England, UK | 1,498,402 | 1,711,248 | 477,881 |
| Belgrade, Serbia | 1,383,875 | 1,681,405 | 1,688,667 |
| Sofia, Bulgaria | 1,547,779 | 1,678,041 | 1,307,439 |
| Nottingham/Derby, England, UK | 768,638 | 1,610,000 | 323,632 |
| Oslo, Norway | 1,064,235 | 1,588,457 | 709,037 |
| Helsinki, Finland | 1,268,296 | 1,573,728 | 672,036 |
| Sheffield, England, UK | 1,596,298 | 1,530,000 | 556,500 |
| Zürich, Switzerland | 1,984,534 | 1,520,968 | 415,367 |
| Sevilla, Spain | 1,877,060 | 1,519,639 | 684,234 |
| Kraków, Poland | 1,276,438 | 1,498,499 | 800,653 |
| Toulouse, France | 1,047,829 | 1,470,899 | 498,003 |
| Bordeaux, France | 994,920 | 1,376,375 | 259,809 |
| Antwerp, Belgium | 1,230,000 | 536,079 | |
| Zagreb, Croatia | 663,592 | 1,217,150 | 767,131 |
| Newcastle, England, UK | 1,141,879 | 286,445 | |
| Cardiff, Wales, UK | 488,153 | 1,140,165 | 362,400 |
| Hanover, Germany | 1,119,032 | 535,932 | |
| Łódź, Poland | 1,100,000 | 658,444 | |
| Bristol, England, UK | 707,412 | 1,090,080 | 472,500 |
| Gdansk, Poland | 1,080,700 | 470,621 | |
| Gothenburg, Sweden | 1,006,548 | 1,070,935 | 600,000 |
| Bilbao, Spain | 1,025,109 | 1,037,847 | 345,821 |
| Thessaloniki, Greece | 802,572 | 1,006,112 | 319,045 |
| Minsk, Belarus | 1,995,471 | ||
| Kazan, Russia | 1,314,685 | ||
| Nizhny Novgorod, Russia | 1,259,013 | ||
| Samara, Russia | 1,163,645 | ||
| Ufa, Russia | 1,157,994 | ||
| Rostov-on-Don, Russia | 1,135,968 |
The People of Europe…
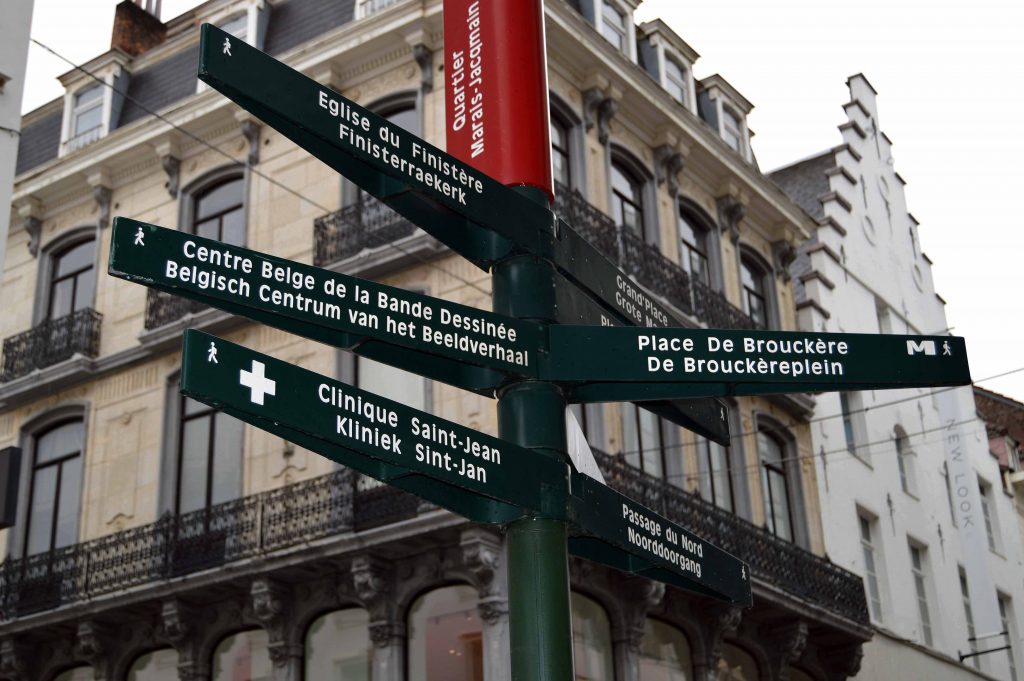
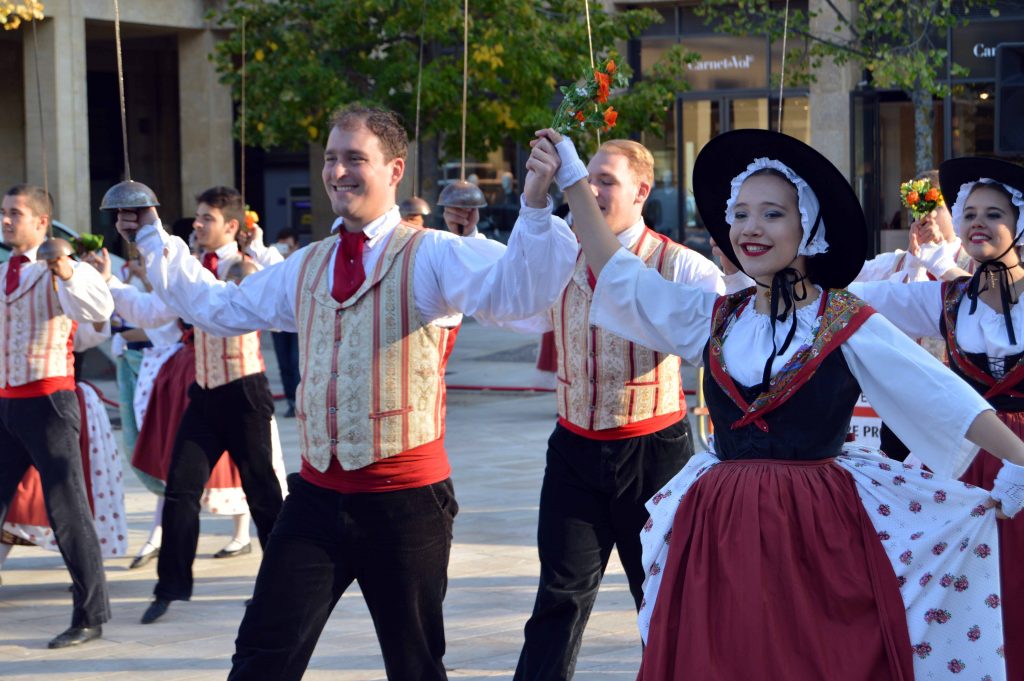
The people of Europe are a composition of many diverse ethno-linguistic groups. Visiting many areas you can see traditional customs observed through special events and in museums. The languages, clothing and cuisines can still be experienced. All of this diverse ethnicity can make Europe one of the best places to travel.
Over the centuries and even the millennia, groups of people have migrated, evolved and in some disappeared all together. Groups of people descended in pre-historic times into the Neolithic and Bronze ages with evidence like Stonehenge and others still existing. Historical populations where noted by Greco-Roman history during the Iron age in these areas.
- Aegean: Greek tribes, Pelasgians, and Anatolians.
- Balkans: Illyrians, Dacians, and Thracians.
- Italian peninsula: Camunni, Rhaetians, Lepontii, Adriatic Veneti, Ligurians, Etruscans, Italic peoples and Greek colonies.
- Western/Central Europe: Celts (list of peoples of Gaul, List of Celtic tribes), Rhaetians and Swabians, Vistula Veneti, Lugii and Balts.
- Iberian peninsula: Pre-Roman peoples of the Iberian Peninsula (Iberians, Lusitani, Aquitani, Celtiberians) Basques and Phoenicians (Carthaginians).
- Sardinia: ancient Sardinians (also known as Nuragic people), comprising the Corsi, Balares and Ilienses tribes.
- West European Isles: Celtic tribes in Britain and Ireland and Picts/Priteni.
- Northern Europe: Finnic peoples, Germanic peoples; the Normans conquered and colonized South Italy and Sicily (Norman conquest of southern Italy).
- Southern Europe: Sicani.
- Eastern Europe: Scythians, Sarmatians.
After the fall of the Roman empire there was a large migration of peoples to Europe. Ethno-linguistic groups that arrived from outside Europe during historical times are:
- Phoenician colonies in the Mediterranean (including regions in Spain, France, Malta, Italy and the Aegean).
- Assyrian conquest of Cyprus, Southern Caucasus (including parts of modern Armenia, Georgia and Azerbaijan) and Cilicia.
- Iranian influence: Achaemenid control of Thrace (512–343 BC) and the Bosporan Kingdom, Cimmerians(possible Iranians), Scythians, Sarmatians, Alans, Ossetes.
- The Jewish diaspora reached Europe in the Roman Empire period. Early Jewish communities in Italy, Central Europe (Gaul).
- The Hunnic Empire (5th century), converged with the Barbarian invasions, contributing to the formation of the First Bulgarian Empire
- The Bulgars (or Proto-Bulgarians), a semi-nomadic people, originally from Central Asia, eventually absorbed by the Slavs.
- The Magyars (Hungarians), a Ugric people, and the Turkic Pechenegs and Khazars, arrived in Europe in about the 8th century (see Hungarian conquest of the Carpathian Basin).
- Arabs conquered Cyprus, Crete, Sicily, some places along the coast of southern Italy, Malta, Greek Empire, Hispania.
- Berber dynasties of the Almoravides and the Almohads ruled much of Spain and Portugal.
- Exodus of Maghreb Christians
- Kipchaks known as Cumans entered the lands of present-day Ukraine in the 11th century.
- Mongol/Tatar invasions (1223–1480), and
- Ottoman control of the Balkans (1389–1878).
- Romani people (Gypsies) arrived during the Late Middle Ages
Ethnic make up by country breaks down along the lines below. Note majority people may be composed of several ethnic groups. Since WWII Europe’s negative population and growth and the migration of people from other countries outside Europe have shifted the face of Europe’s culture slightly.
ALBANIA
Majority: Albanians 82.5%
Regional Majority: none
Minorities: Greeks 2%, others 2%
AUSTRIA
Majority: Austrian-Germans 85%
Regional Majority: none
Minorities: Yugoslavs 5.2%, Turks 2.2%, Hungarians 1%, others 6.6%
BELARUS
Majority: Belarusians 83.5%
Regional Majority: none
Minorities: Russians 8.3% , Poles 3.1%, Ukrainians 1.7%, others 3.2%
BELGIUM
Majority: Flemings 58%
Regional Majority: Walloons 38%, Germans 1%
Minorities: Luxembourgers, Eastern or Southern Europeans, Africans and Asians and Latin Americans 10%
BOSNIA & HERZEGOVINA
Majority: Bosniaks 51.11%
Regional Majority: Serbs 30.78%, Croats 15.43%
Minorities: other 2.73%
BULGARIA
Majority: Bulagrians 84.8%
Regional Majority: Turks 8.8%
Minorities: Roma 4.9%, others 1.5% (includes Russians, Armenians, Tartars & Vlach)
CROATIA
Majority: Croats 90.4%
Regional Majority: none
Minorities: Serbs 4.4%, others 5.2% (including Bosniaks, Hungarians, Slovenes, Czechs, Dalmatian Italians, Austrian-Germans, Romanians and Romani)
![]() DENMARK
DENMARK
Majority: Danes 88.7%
Regional Majority: Faroese
Minorities: other Scandinavian, Germans, Frisians, other European, Greenlandic Inuit and others
ESTONIA
Majority: Estonians 68.7%
Regional Majority: Russians 24.9%
Minorities: Ukrainians 1.8%, Belarusians 0.9%, Finns 0.6% and others 3.6%
FINLAND
Majority: Finns 89%
Regional Majority: Swedes 5.3%
Minorities: Russians 1.3% and Estonians 0.8%
![]() FRANCE
FRANCE
Majority: French 86%
Regional Majority: Bretons, Corsicans, Occitans, Alsatians, Arpitans, Basques, Catalans and Flemings
Minorities: other European 7%, North African 7%, Sub-Saharan African, Indochinese, Asian, Latin American and Pacific Islander
GERMANY
Majority: Germans 80.8%
Regional Majority: Frisians and Sorbians
Minorities: other Europeans 11.7%, West Asians, Turks 3.4%, Arabs, other Asians 1.3%, Africans 0.6% and Americans 0.5%
GREECE
89.8%
Regional Majority: Muslim minority, Armenians and Jews
Minorities: Albanians 4%, Romani 1.5-2.3%, Aromanians 1.8%, Macedonians/Bulgarians 0.9-1.8%, Cretan Turks est. 1% and Arvanites 0.9%
![]() HUNGARY
HUNGARY
Majority: Hungarians 85.6%
Regional Majority: none
Minorities: Romani 3.2%, Germans 1.9%, others (i.e. Romanians, Slovaks, Croats, Serbs, Slovenes and Ruthenians) or not stated 14.1%
ICELAND
Majority: Icelanders 91%
Regional Majority: none
Minorities: Poles 4% and others 5% (examples are Filipinos, Greeks, Portuguese people and Russians
IRELAND
Majority: Irish 82.2%
Regional Majority: none
Minorities: other white (large numbers of Britons, Latvians, Poles and Ukrainians) 9.5%, Asians 2.1%, blacks 1.2%, Irish Travellers 0.7% and others/not stated 4.3%
ITALY
Majority: Italians 92.8%
Regional Majority: Aosta Valley French, Friulians, South Tirol Germans, Sardinians, and Sicilians.
Minorities: North Africans 1%, Romanians 1%, Asians (non-Chinese) 0.8%, Albanians 0.8%, Sub-Saharan Africans 0.5%, Latin Americans 0.5%, Chinese 0.3%, Ukrainians 0.3% and others 1%. Arbëreshë, Italiot Greeks, Catalans, Occitans, Ladins, Croats, Romani and Italian Jews.
LATVIA
Majority: Latvians 62.%
Regional Majority: Latgalians, and Russians 25.4%
Minorities: Belarusian 3.3%, Ukrainians 2.2%, Poles 2.1%, Lithuanians 1.1% and others/unspecified 4.8%
LITHUANIA
Majority: Lithuanians 86.7%
Regional Majority: none
Minorities: Poles 5.6%, Russians 4.8%, Belarusians 1.3%, Ukrainians 0.7% and others 0.9%
MALTA
Majority: Maltese 95.2%
Regional Majority: none
Minorities: non-Maltese 4.8%
MOLDOVA
Majority: Moldovans 75.1%
Regional Majority: Gagauzs 4.6%, Bulgarians 1.9%, and Romani
Minorities: Romanians 7%, Ukrainians 6.6%, Russians 4.1%, and others 0.8%
MONTENEGRO
Majority: Montenegrins 45%
Regional Majority: Serbs 28.7% and Sandžak Muslims
Minorities: Bosniaks and Muslims by nationality 11.9%, Albanians 4.9%, Croats 0.9%, Romani 0.8%, Macedonians 0.1% and others 4.9%
NETHERLANDS
Majority: Dutch 77.4%
Regional Majority: Frisians
Minorities: other Europeans 9.9%, Turks 2.3%, Moroccans 2.3%, Indonesians2.1%, Surinamese 2%, Caribbeans 0.9%, Americans 0.2% and others 2.9%
NORTH MACEDONIA
Majority: Macedonians 64%
Regional Majority: Albanians 25.2%, Turks 4%
Minorities: Romani 2.7%, Serbs 1.8%, and other (i.e. Bosniaks, Aromanians, Croats, Montenegrins and Bulgarians) 2.2%
![]() NORWAY
NORWAY
Majority: Norwegians 85 – 87%
Regional Majority: Sami 1.2 – 2.5%
Minorities: Poles 1.4%. approximately 12% (Swedes, Pakistanis, Somalis, Iraqis and Kurds, Vietnamese, Germans, Lithuanians, Russians and Indians
POLAND
Majority: Poles 98%
Regional Majority: Frisians
Minorities: others or not started 2%
![]() PORTUGAL
PORTUGAL
Majority: Portuguese 96.3%
Regional Majority: Mirandese
Minorities: others 3.7% like Afro-Portuguese, Chinese people, Latin Americans, Ukrainians and ex-Yugoslavs
![]() ROMANIA
ROMANIA
Majority: Romanians 83.4%
Regional Majority: Hungarians 6.1%
Minorities: Romani 3.0%, Germans 0.2%, Ukrainians 0.2%, Turks 0.2%, Russians 0.1% and Chinese 0.1%
RUSSIA
Majority: Russians 80.9%
Regional Majority: Tatars 3.9%, Bashkirs 1.2%, Chuvash1%, Chechens 1%, Ossetians 0.4%, Kabardians 0.4%, Ingush 0.3%, Kalmyks 0.1%
Minorities: Ukrainians 1.4%, Armenians 0.9%, Avars 0.7%, Mordvins 0.5% and others.
SERBIA
Majority: Serbian 83.3%
Regional Majority: none
Minorities:Hungarians 3.5%, Romani 2.1%, Bosniaks and Muslims by nationality 2.3%, Croats 0.8%, Slovaks 0.7%, Montenegrins 0.5%, Vlachs 0.5%, Romanians 0.4%, Yugoslavs 0.3%, Macedonians0.3%, Bulgarians 0.3% and others/unspecified 5.1%.
![]() SLOVAKIA
SLOVAKIA
Majority: Slovaks 80.7%
Regional Majority: Hungarians 8.5%
Minorities:Romani 2.0%, Czechs 0.6%, Rusyns 0.6%, Ukrainians 0.1% and others/unspecified 7.5%
SLOVENIA
Majority: Slovenes 83.1%
Regional Majority: none
Minorities: Serbs 2%, Croats 1.8%, Bosniaks 1.1%, others (Dalmatian Italians, Germans, Hungarians and Romanians) and/or unspecified 12%
SPAIN
Majority: Spaniards 89%
Regional Majority: Included Castilians and Leonese, Catalans/Valencians, Galicians, Asturians, Basques and Canarians
Minorities: Gypsies, Jews, Latin Americans, Romanians, North Africans, sub-Saharan Africans, Chinese, Filipinos, Levant Arabs, British
SWEDEN
Majority: Swedes 88%
Regional Majority: Finns (Tornedalians), Sami people and Kvens
Minorities: Finns (Sweden Finns), Yugoslavs (Serbs, Croats and Bosniaks), Danes, Norwegians, Russians, Arabs (Lebanese and Syrians), Syriacs, Greeks, Turks, Iranians, Iraqis, Pakistanis, Thais, Koreans and Chileans
![]() SWITZERLAND
SWITZERLAND
Majority: German Speakers 63%
Regional Majority: French-speakers 22,7%, Italian-speakers 8.4% and Romansh people 0.6
Minorities: others 5.9%
![]() TURKEY
TURKEY
Majority: Turks 73%%
Regional Majority: Kurds 12%
Minorities: others 15%: Zazas, Laz, Jews, Greeks, Georgians, Circassians, Bulgarians, Bosniaks, Assyrians, Armenians, Arabs, Albaniansand Romanians
UKRAINE
Majority: Ukrainians 77.8%
Regional Majority: Russians 17.3%
Minorities: Belarusians 0.6%, Moldovans 0.5%, Crimean Tatars 0.5%, Bulgarians 0.4%, Hungarians 0.3%, Romanians 0.3%, Poles0.3%, Jews 0.2%, Armenians 0.1%, Urums 0.1% and others 1.8%
![]() UNITED KINGDOM
UNITED KINGDOM
Majority: White British 87.1%
Regional Majority: (consisting of English, Scottish, Welsh, Northern Irish (could also be counted as Irish), also Cornish, Manx and Channel Islanders). Included are the inhabitants of Gibraltar
Minorities: Black British 3%, British Asians 6.9% and others 3%
The Religions of Europe…
While most religions of the world are practice in Europe most countries have a dominant religion. Events within a country over a period of time have led one religion to become more widely practiced than others. The religions below are categorized by the countries in which they are primarily practiced.
While the reformation started in Germany some areas are still Catholic while the rest are protestant. Switzerland and Northern Ireland is divided amongst Protestant & Catholic as the primary religion.
On Cyprus the Turkish populated northern area is predominately Islam while the Greek southern area is Eastern Orthodox.
EASTERN ORTHODOX
- Belarus
- Bulgaria
- Cyprus
- Greece
- North Macedonia
- Moldova
- Montenegro
- Romania
- Russia
- Serbia
- Ukraine
PROTESTANT
- Denmark
- Estonia
- Finland
- Iceland
- Latvia
- Netherlands
- Norway
- Sweden
- United Kingdom (England, Scotland, Wales)
ISLAM
- Albania
- Bosnia Herzegovina
- Kosovo
- Turkey
ROMAN CATHOLIC
- Andorra
- Austria
- Belgium
- Croatia
- Czechia
- France
- Hungary
- Ireland
- Italy
- Liechtenstein
- Lithuania
- Luxembourg
- Malta
- Monaco
- Poland
- Portugal
- San Marino
- Slovakia
- Slovenia
- Spain
Since the second world war the percentage of those people who do not have any religious affiliation has grown. Communist countries had strict regulations on religions and their churches. In western Europe, the belief in God has declined. France has the largest percentage of its population with 33% professing no belief in God and Turkey, Malta, Romania and Poland with only 1%. Turkey and Malta also have the highest percentage of believers in God at 95% of their populations and Estonia has the lowest at 16%. However, over 54% of Estonians have a belief in a spirit or force as do over half of European countries.
ALBANIA
Subtitle for Muslim 56.7%, Roman Catholic 10%, Orthodox 6.8%, atheist 2.5%, Bektashi (a Sufi order) 2.1%, other 5.7%, unspecified 16.2%(2011 est.) note: all mosques and churches were closed in 1967 and religious observances prohibited; in November 1990, Albania began allowing private religious practice
ANDORRA
Roman Catholic (predominant)
AUSTRIA
Subtitle Catholic 57%, Eastern Orthodox 8.7%, Muslim 7.9%, Evangelical Christian 3.3%, other/none/unspecified 23.1% (2018 est.) note: data on Muslim is a 2016 estimate; data on other/none/unspecified are from 2012-2018 estimates
BELARUS
Orthodox 48.3%, Catholic 7.1%, other 3.5%, non-believers 41.1% (2011 est.)
BELGIUM
Roman Catholic 50%, Protestant and other Christian 2.5%, Muslim 5%, Jewish 0.4%, Buddhist 0.3%, atheist 9.2%, none 32.6% (2009 est.)
BOSNIA & HERZEGOVINA
Muslim 50.7%, Orthodox 30.7%, Roman Catholic 15.2%, atheist 0.8%, agnostic 0.3%, other 1.2%, undeclared/no answer 1.1% (2013 est.)
BULGARIA
Eastern Orthodox 59.4%, Muslim 7.8%, other (including Catholic, Protestant, Armenian Apostolic Orthodox, and Jewish) 1.7%, none 3.7%, unspecified 27.4% (2011 est.)
CROATIA
Roman Catholic 86.3%, Orthodox 4.4%, Muslim 1.5%, other 1.5%, unspecified 2.5%, not religious or atheist 3.8% (2011 est.)
CYPRUS
Orthodox Christian 89.1%, Roman Catholic 2.9%, Protestant/Anglican 2%, Muslim 1.8%, Buddhist 1%, other (includes Maronite, Armenian Church, Hindu) 1.4%, unknown 1.1%, none/atheist 0.6% (2011 est.) note: data represent only the government-controlled area of Cyprus
![]() CZECHIA
CZECHIA
Roman Catholic 10.4%, Protestant (includes Czech Brethren and Hussite) 1.1%, other and unspecified 54%, none 34.5% (2011 est.)
![]() DENMARK
DENMARK
Evangelical Lutheran (official) 74.7%, Muslim 5.5%, other/none/unspecified (denominations of less than 1% each in descending order of size include Roman Catholic, Jehovah’s Witness, Serbian Orthodox Christian, Jewish, Baptist, Buddhist, Mormon, Pentecostal, and nondenominational Christian) 19.8% (2019 est.)
ESTONIA
Orthodox 16.2%, Lutheran 9.9%, other Christian (including Methodist, Seventh-Day Adventist, Roman Catholic, Pentecostal) 2.2%, other 0.9%, none 54.1%, unspecified 16.7% (2011 est.)
FINLAND
Lutheran 69.8%, Greek Orthodox 1.1%, other 1.7%, unspecified 27.4% (2018 est.)
![]() FRANCE
FRANCE
Christian (overwhelmingly Roman Catholic) 63-66%, Muslim 7-9%, Buddhist 0.5-0.75%, Jewish 0.5-0.75%, other 0.5-1.0%, none 23-28% (2015 est.) note: France maintains a tradition of secularism and has not officially collected data on religious affiliation since the 1872 national census, which complicates assessments of France’s religious composition; an 1872 law prohibiting state authorities from collecting data on individuals’ ethnicity or religious beliefs was reaffirmed by a 1978 law emphasizing the prohibition of the collection or exploitation of personal data revealing an individual’s race, ethnicity, or political, philosophical, or religious opinions; a 1905 law codified France’s separation of church and state
GERMANY
Roman Catholic 27.7%, Protestant 25.5%, Muslim 5.1%, Orthodox 1.9%, other Christian 1.1%, other .9%, none 37.8% (2018 est.)
GREECE
Greek Orthodox (official) 81-90%, Muslim 2%, other 3%, none 4-15%, unspecified 1% (2015 est.)
HOLY SEE
Roman Catholic
![]() HUNGARY
HUNGARY
Roman Catholic 37.2%, Calvinist 11.6%, Lutheran 2.2%, Greek Catholic 1.8%, other 1.9%, none 18.2%, no response 27.2% (2011 est.)
ICELAND
Evangelical Lutheran Church of Iceland (official) 67.2%, Roman Catholic 3.9%, Reykjavik Free Church 2.8%, Hafnarfjordur Free Church 2%, Asatru Association 1.2%, The Independent Congregation .9%, other religions 4% (includes Zuist and Pentecostal), none 6.7%, other or unspecified 11.3% (2018 est.)
IRELAND
Roman Catholic 78.3%, Church of Ireland 2.7%, other Christian 1.6%, Orthodox 1.3%, Muslim 1.3%, other 2.4%, none 9.8%, unspecified 2.6% (2016 est.)
ITALY
Christian 83.3% (overwhelmingly Roman Catholic with very small groups of Jehovah’s Witnesses and Protestants), Muslim 3.7%, unaffiliated 12.4%, other 0.6% (2010 est.)
LATVIA
Lutheran 36.2%, Roman Catholic 19.5%, Orthodox 19.1%, other Christian 1.6%, other 0.1%, unspecified/none 23.5% (2017 est.)
LIECHTENSTEIN
Roman Catholic (official) 73.4%, Protestant Reformed 6.3%, Muslim 5.9%, Christian Orthodox 1.3%, Lutheran 1.2%, other Protestant .7%, other Christian .3%, other .8%, none 7%, unspecified 3.3% (2015 est.)
LITHUANIA
Roman Catholic 77.2%, Russian Orthodox 4.1%, Old Believer 0.8%, Evangelical Lutheran 0.6%, Evangelical Reformist 0.2%, other (including Sunni Muslim, Jewish, Greek Catholic, and Karaite) 0.8%, none 6.1%, unspecified 10.1% (2011 est.)
LUXEMBOURG
Christian (predominantly Roman Catholic) 70.4%, Muslim 2.3%, other (includes Buddhist, folk religions, Hindu, Jewish) 0.5%, none 26.8% (2010 est.)
MALTA
Roman Catholic (official) more than 90% (2006 est.)
MOLDOVA
Orthodox 90.1%, other Christian 2.6%, other 0.1%, agnostic (2014 est.)
MONACO
Roman Catholic 90% (official), other 10%
MONTENEGRO
Orthodox 72.1%, Muslim 19.1%, Catholic 3.4%, atheist 1.2%, other 1.5%, unspecified 2.6%(2011 est.)
NETHERLANDS
Roman Catholic 23.6%, Protestant 14.9% (includes Dutch Reformed 6.4%, Protestant Church of The Netherlands 5.6%, Calvinist 2.9%), Muslim 5.1%, other 5.6% (includes Hindu, Buddhist, Jewish), none 50.7% (2017 est.)
NORTH MACEDONIA
Macedonian Orthodox 64.8%, Muslim 33.3%, other Christian 0.4%, other and unspecified 1.5% (2002 est.)
![]() NORWAY
NORWAY
Church of Norway (Evangelical Lutheran – official) 70.6%, Muslim 3.2%, Roman Catholic 3%, other Christian 3.7%, other 2.5%, unspecified 17% (2016 est.)
POLAND
Catholic 85.9% (includes Roman Catholic 85.6% and Greek Catholic, Armenian Catholic, and Byzantine-Slavic Catholic .3%), Orthodox 1.3% (almost all are Polish Autocephalous Orthodox), Protestant 0.4% (mainly Augsburg Evangelical and Pentacostal), other 0.4% (includes Jehovah’s Witness, Buddhist, Hare Krishna, Gaudiya Vaishnavism, Muslim, Jewish, Mormon), unspecified 12.1% (2017 est.)
![]() PORTUGAL
PORTUGAL
Roman Catholic 81%, other Christian 3.3%, other (includes Jewish, Muslim) 0.6%, none 6.8%, unspecified 8.3% (2011 est.) note:represents population 15 years of age and older
![]() ROMANIA
ROMANIA
Eastern Orthodox (including all sub-denominations) 81.9%, Protestant (various denominations including Reformed and Pentecostal) 6.4%, Roman Catholic 4.3%, other (includes Muslim) 0.9%, none or atheist 0.2%, unspecified 6.3% (2011 est.)
RUSSIA
Russian Orthodox 15-20%, Muslim 10-15%, other Christian 2% (2006 est.) note: estimates are of practicing worshipers; Russia has large populations of non-practicing believers and non-believers, a legacy of over seven decades of official atheism under Soviet rule; Russia officially recognizes Orthodox Christianity, Islam, Judaism, and Buddhism as the country’s traditional religions
SAN MARINO
Roman Catholic (predominant)
SERBIA
Orthodox 84.6%, Catholic 5%, Muslim 3.1%, Protestant 1%, atheist 1.1%, other 0.8% (includes agnostics, other Christians, Eastern, Jewish), undeclared or unknown 4.5% (2011 est.) note: most ethnic Albanians boycotted the 2011 census
![]() SLOVAKIA
SLOVAKIA
Roman Catholic 62%, Protestant 8.2%, Greek Catholic 3.8%, other or unspecified 12.5%, none 13.4% (2011 est.)
SLOVENIA
Catholic 57.8%, Muslim 2.4%, Orthodox 2.3%, other Christian 0.9%, unaffiliated 3.5%, other or unspecified 23%, none 10.1% (2002 est.)
SPAIN
Roman Catholic 68.9%, atheist 11.3%, agnostic 7.6%, other 2.8%, non-believer 8.2%, unspecified 1.1% (2019 est.)
SWEDEN
Church of Sweden (Lutheran) 60.2%, other (includes Roman Catholic, Orthodox, Baptist, Muslim, Jewish, and Buddhist) 8.5%, none or unspecified 31.3% (2017 est.) note: estimates reflect registered members of faith communities eligible for state funding (not all religions are state-funded and not all people who identify with a particular religion are registered members); an estimated 57.7% of Sweden’s population were members of the Church of Sweden in 2018
![]() SWITZERLAND
SWITZERLAND
Roman Catholic 35.9%, Protestant 23.8%, other Christian 5.9%, Muslim 5.4%, Jewish 0.3%, other 1.4%, none 26%, unspecified 1.4% (2017 est.)
![]() TURKEY
TURKEY
Muslim 99.8% (mostly Sunni), other 0.2% (mostly Christians and Jews)
UKRAINE
Orthodox (includes the Orthodox Church of Ukraine (OCU) and the Ukrainian Orthodox – Moscow Patriarchate (UOC-MP)), Ukrainian Greek Catholic, Roman Catholic, Protestant, Muslim, Jewish (2013 est.) note: Ukraine’s population is overwhelmingly Christian; the vast majority – up to two thirds – identify themselves as Orthodox, but many do not specify a particular branch; the OCU and the UOC-MP each represent less than a quarter of the country’s population, the Ukrainian Greek Catholic Church accounts for 8-10%, and the UAOC accounts for 1-2%; Muslim and Jewish adherents each compose less than 1% of the total population
![]() UNITED KINGDOM
UNITED KINGDOM
Christian (includes Anglican, Roman Catholic, Presbyterian, Methodist) 59.5%, Muslim 4.4%, Hindu 1.3%, other 2%, unspecified 7.2%, none 25.7% (2011 est.)